
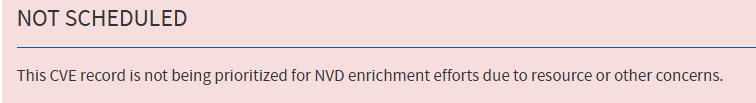
On April 15, NIST announced that it would no longer attempt enrichment for every CVE. Vulnerabilities are still ingested by the National Vulnerability Database, but enrichment is now reserved for a selected subset. Everything else will be marked as Not Scheduled.
That may sound strategic, but is actually problematic. For years, NIST established itself as an authoritative source of vulnerability data. Teams have come to rely on their assessment of CVSS, CWE, and CPE for vulnerability management and automation.
A quick recap
Prior to their announcement in April, NIST had been struggling with a backlog for years. This pile-up of vulnerabilities initially arose in 2024 due to a mix of contract renewal delays and staffing problems:
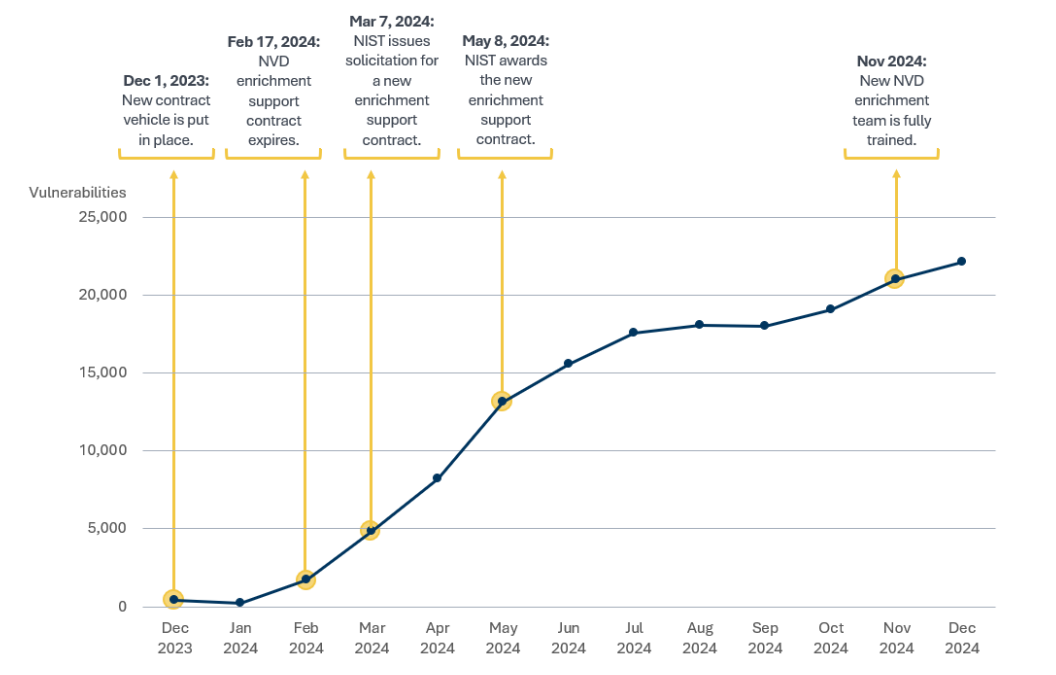
Source: OIG analysis of NIST data
Our own data confirms that NIST enriched nearly 42,000 CVEs in 2025, a significant increase in operational capacity of 130% over the year before.
Additionally, NIST reported that CVE submissions increased 263% between 2020 and 2025. Submissions in the first three months of 2026 were already nearly one-third higher than the same period last year.
Despite their best efforts to increase operational capacity, NIST was unable to clear their backlog while processing the high influx of new vulnerabilities. Faced with no long-term solution, that brings us to the operational policy we have now.
Current state
NIST’s recent decision to enrich only a small subset of vulnerabilities has been widely covered, but less so what it means for downstream consumers beyond the fact. With this post, we hope to provide a more comprehensive perspective on the current state of vulnerability data and what it means for vulnerability management.
We looked at the vulnerability data over a two-month period from 2026-04-15, the day the new prioritization strategy was implemented, all the way through 2026-06-15.
Coverage
The importance of coverage practically speaks for itself. Without enrichment, you may be blind to the vulnerabilities that impact you and how severe they are.
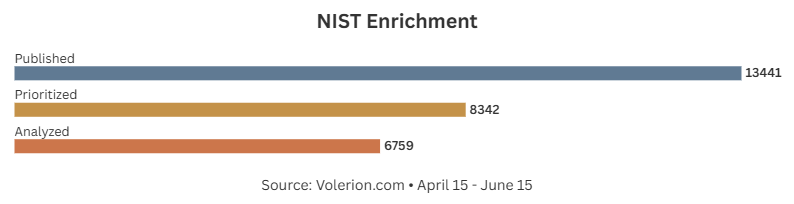
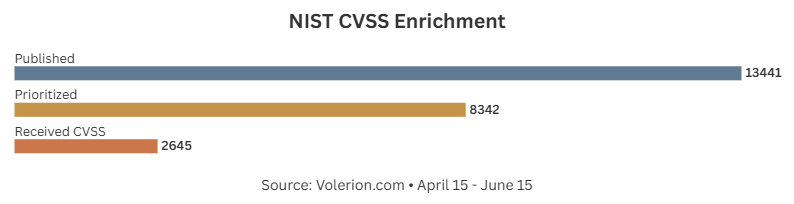
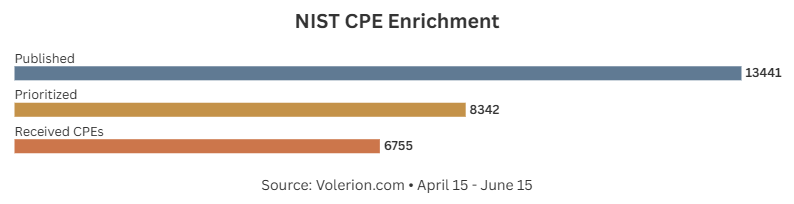
Within the review window, 13,441 non-rejected CVEs were published. No more than 8,342 were prioritized for enrichment by NIST. This leaves 5,099 CVEs that were not scheduled for enrichment under the current prioritization model.
However, out of those to-be-enriched vulnerabilities, only 6,759 actually received NIST analysis. This means that 1,583 CVEs were published and selected for enrichment, but remain unanalyzed.
Of the vulnerabilities that did receive a NIST analysis, only 2,645 received a NIST CVSS vector. That is roughly 20% of all CVEs published within the reviewed period.
A fifth of all vulnerabilities isn’t much, but is likely due to NIST choosing to omit CVSS where the CNA had already provided it. However, CNA vectors are produced by many different organizations, each with varying levels of expertise, bias, and consistency. This is why NIST vectors were in demand. They came from an independent and, on paper, knowledgeable and reputable source. FedRAMP makes that dependency explicit. Cloud providers must use NIST’s CVSS v3.x score. A strategy that is no longer viable.
Product mapping held up better in comparison, but leaves definite room for improvement: out of the 8,342 prioritized CVEs, 6,755 received CPE assignment. That still leaves 1,587 prioritized CVEs without standardized product mappings from NIST.
CPEs are the backbone of asset inventories, and since NIST is solely responsible for maintenance of the official CPE dictionary, this should be a priority, if anything.
Speed
Coverage is only part of the picture. Even if enrichment does eventually arrive, timeliness matters. For teams that depend on vulnerability data in active workflows, a delay can be the difference between same-day triage and a growing queue of unknown, unprocessed findings.
The monthly comparison below shows the median time-to-analysis by month in 2026.
| Month | NIST Time To Analysis |
|---|---|
| January | 10 days, 14 hours, 54 minutes |
| February | 4 days, 19 minutes |
| March | 3 days, 16 hours, 39 minutes |
| April | 5 days, 20 hours, 51 minutes |
| May | 3 days, 18 hours, 4 minutes |
| June | 1 day, 22 hours |
Note that median time-to-analysis is biased in NIST’s favor. The weekly status breakdown below shows why the current median understates the real delay.
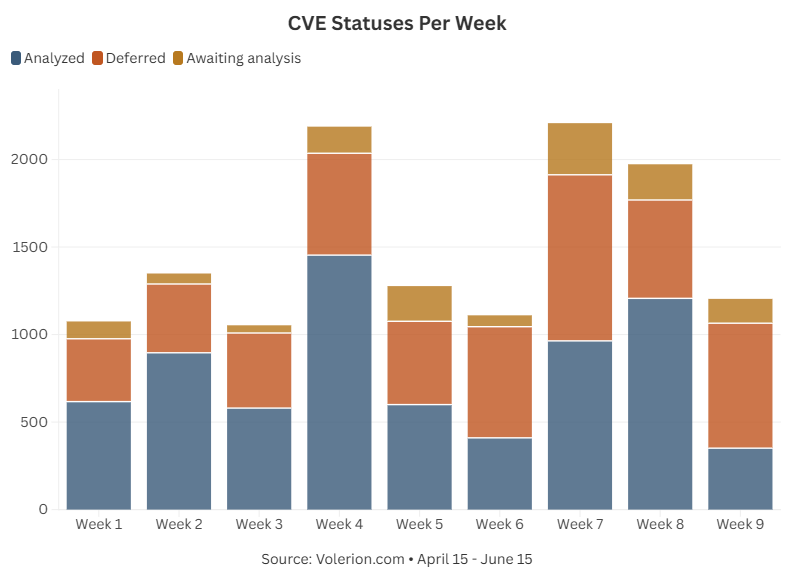
Each week still includes older CVEs in Awaiting Analysis status. Because those cases are still in progress, they cannot yet be included in the completed-case timing statistics, which makes the current median understate the true delay.
Another way to test whether the new strategy is working is to compare how many CVEs were prioritized for enrichment each week against how many initial analyses NIST completed that same week.
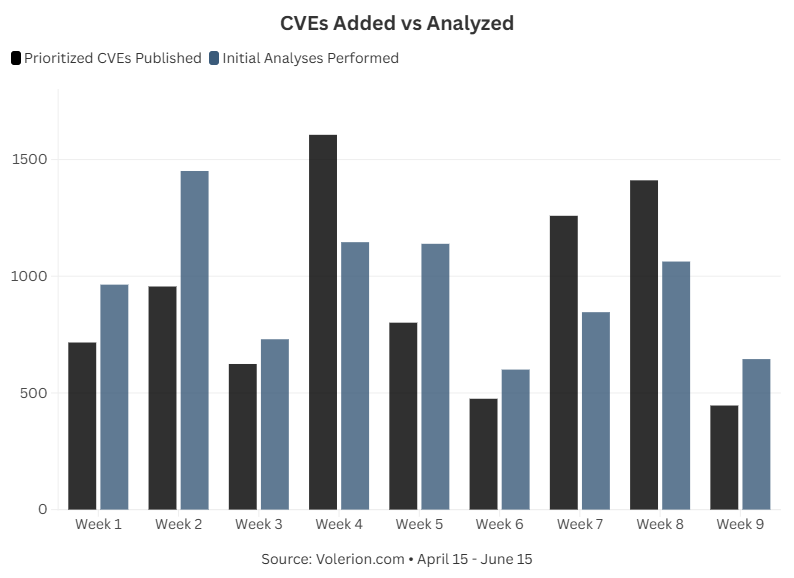
There is no perfectly stable pattern here. Some weeks bring a large wave of new CVEs, while other weeks are quieter. The same is true of NIST’s output. Some weeks they complete far more analyses than others.
What the chart suggests is a capacity ceiling rather than a simple steady decline. In slower or more typical weeks, NIST usually analyzes vulnerabilities slightly faster than they arrive, but when weekly publish volume spikes, NIST appears to fall behind. That means the deferred strategy can work under normal conditions, yet it still looks sensitive to higher-volume weeks. If CVE volume keeps climbing, NIST will need to increase capacity or those vulnerabilities will pile up.
Accuracy
Accuracy is the most complex, nuanced metric to validate because it requires a sizeable and qualitative ground truth. That is exactly why it’s so useful that we have our own independent analysis data readily available.
Scoring
To determine CVSS accuracy, we looked at cases where our vector diverged from NIST, and examined whether their metric choices were supported by the CVSS specification and vulnerability context.
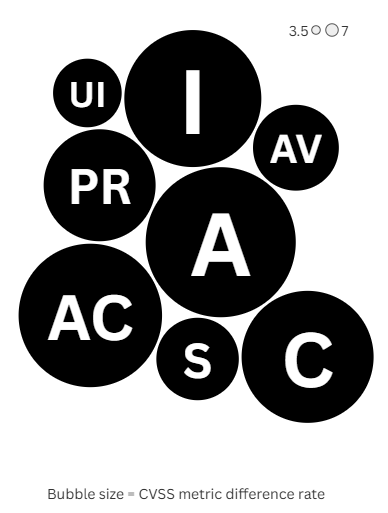
Across the CVEs where our CVSS 3.1 vector differed from the vector published by NIST, differences were not spread evenly across metrics.
The most common difference was attack complexity. In roughly a third of disagreements, NIST used AC:L where our analysis used AC:H. Differences around PR (Privileges Required) and UI (User Interaction) also appeared often. The broad pattern seems to be that NIST implements a checklist approach that requires a very literal signal (“This has high attack complexity”) in order for complexities to register. Otherwise, exploitation barriers such as privilege requirements or user interaction are left out, even when an attack inherently requires it. As is the case with UI:R for Cross-Site Scripting.
We also saw recurring differences in impact metrics, with NIST often assigning higher loss of Confidentiality, Integrity, or Availability than we do. That does not prove one side is always right, but it does show that the divergence is systemic rather than isolated.
To make that more concrete, it helps to look at one CVE from this two-month period where the severity difference is especially large.
CVE-2026-8856
IBM HTTP Server 8.5, and 9.0 is vulnerable to denial of service in configurations where an attacker has write access to parts of the server configuration.
| Source | CVSS 3.1 score | Vector |
|---|---|---|
| NIST | 9.1 critical | AV:N/AC:L/PR:N/UI:N/S:U/C:N/I:H/A:H |
| Volerion | 4.4 medium | AV:L/AC:L/PR:H/UI:N/S:U/C:N/I:N/A:H |
| IBM Corporation (CNA) | 7.7 high | AV:L/AC:L/PR:N/UI:N/S:U/C:N/I:H/A:H |
The difference comes from distinct understanding about how the attack starts, the impact it produces, and their application in CVSS.
In an attempt to make that process transparent, our vectors are backed by an attack flow artifact. We use LLMs to model realistic attack scenarios as a sequence of steps and conditions, with each node carrying the necessary characteristics such as attacker proximity, privileges, etc. We then programmatically derive the CVSS vector from that structure.
An attack (see our graph) against this vulnerability starts with attacker action “Modify a Writable Server Configuration Section”. That matches IBM’s own advisory language where an attacker must have write access to part of the server’s configuration.
That is where the attack vector assumptions in the three vectors become easier to compare. The CVSS 3.1 specification states that when “the attacker’s path is via read/write/execute capabilities,” the attack vector should be scored as local. For this CVE, that matters because modifying server configuration is itself a read/write action, and in practice it also implies some level of privilege over that configuration surface (through the OS most likely).
Against that baseline, the three vectors reflect different threat models. Our vector treats the configuration change as part of the attack path, which leads to AV:L (local attack vector) and PR:H (high privileges required). NIST uses AV:N (network attack vector) and PR:N (no privileges required), while IBM uses AV:L but still keeps PR:N. The main point of comparison is whether the required ability to modify configuration is treated as a prerequisite that carries local access and privileges, or whether it is a remote unauthenticated attacker that can exploit this vulnerability.
Technical impact differs as well. NIST and IBM both assign A:H (high availability impact) and I:H (high integrity impact), while the described behavior is only that the server consumes resources until it crashes or hangs. Our vector models that outcome as an availability effect rather than an integrity effect, so it scores the impact as denial of service without adding a high integrity loss.
Seen side-by-side, the score gap comes from a differently modeled attack path. In cases like this, NIST appears to stay close to CNA-provided values even where the source material does not clearly support the resulting metrics. Our score is bound to the direct evidence in the source material, the modeled prerequisites in the attack graph, and the CVSS rules applied to that path.
CVE-2026-12026
Out of bounds read in Video in Google Chrome on ChromeOS prior to 149.0.7827.115 allowed a remote attacker who had compromised the renderer process to obtain potentially sensitive information from process memory via a crafted HTML page. (Chromium security severity: High)
| Source | CVSS 3.1 score | Vector |
|---|---|---|
| NIST | 6.5 medium | AV:N/AC:L/PR:N/UI:R/S:U/C:H/I:N/A:N |
| Volerion | 5.3 medium | AV:N/AC:H/PR:N/UI:R/S:U/C:H/I:N/A:N |
| Chrome (CNA) | Not available | Not available |
The previous example showed a case where attack vector, privileges required, and impact all differed. Though as seen in our earlier bubble graphic, the most common reason our vectors diverged from NIST was Attack Complexity. So to look at that dominant pattern directly, it helps to take the most recent CVE from this period where that difference appears.
Our analysis matches the NIST vector exactly apart from AC:H (high attack complexity), where NIST uses AC:L (low attack complexity).
Our attack graph for this vulnerability makes it straightforward to see why UI:R (user interaction required) is reasonable. The vulnerability description states the issue can be triggered “via a crafted HTML page,” which means a victim has to browse to attacker-controlled content. Both NIST and our analysis reflect that with UI:R.
The main difference is in the prerequisites. Chrome’s description limits the issue to Google Chrome on ChromeOS and says the attacker must have already compromised the renderer process. In the graph, those appear as explicit conditions rather than implied assumptions.
That is exactly the kind of distinction attack complexity is meant to capture. It separates vulnerabilities that are easily exploitable from those that depend on specific prerequisite conditions. The difference affects how realistic exploitation is in practice, and therefore how it should be treated by downstream consumers.
Note that our graph shows the CVSS 4.0 vector, which distinguishes between Attack Complexity (AC) and Attack Requirements (AT). Both of these metrics are compressed into Attack Complexity (AC) in CVSS 3.1.
Our response
Despite reducing the scope of their enrichment workload, NIST still struggles to meet the bar they set for themselves. About half of all new vulnerabilities remain unanalyzed. Teams that want their vulnerability management programs to keep operating the way they used to can no longer depend on NIST alone. If they still need complete, timely, and consistent enrichment data, they will have to get it from another source.
In response, we are releasing our own NVD-compatible API. It follows the NVD 2.0 response format, so security teams can plug it into existing workflows without rebuilding their integrations or adopting a new data model. Every new CVE is enriched with CVSS 3.1 and CVSS 4.0 vectors, CPEs validated against the official CPE dictionary, tagged references, and richer descriptions, typically within minutes of publication.
This data comes from the same enrichment pipeline we built for enterprise use. You can start for free to experience the operational difference that quality and timely data can make.